Contextual Inquiry and Consulting Foundations
Overview
As part of a group of 4 people, I engaged with a client(contact deeptipandey111@gmail.com for non-anonymous report and presentation). Over a course of 4 month, we established the client's problem, collected detailed information via semi-structured interviews from a diverse set of stakeholders while also conducting background research to get to the bottom of the problem. After each interview, we huddled up to interpret the interview to understand and syntesizse the informtion we gathered thus far. After we finished all the interviews, we built an affinity wall to organize our findings and ideas. We then sorted these ideas into clusters to make more sense of them to identify the real main problem and then worked backwards to research and make our recommendations.
Immersion
We met with our client for a deep dive into the organization structure and its data enclave. We clearly defined the project’s scope and identified responsibilities for both the research and client teams. After our initial client meeting, we scheduled meetings to gauge the general dynamic as well as digging deeper into the problem, the background and interviewees opinions. We conducted a thorough background research that included the problem of Data Citation Tracking, sector analysis, competitive analysis, existing solutions and the client background and how far they already have come.
Interviews
In order to acquire a diverse set of information and opinions, we scheduled seven interviews evenly spaced and these were from the following categories:
- Research Community
- Management
- Staff
Spreading out our interviews with nearly all major stakeholders gave us a fair insight into different aspects of the problem. These semi-structured interviews were conducted as one-on-one, 60- to 90-minute in-depth discussions.
Our goal for conducting the interviews was to answer these overarching questions:
- Do researchers understand why this data is important to the research community?
- Are researchers interested or excited about using or reporting this data?
- What would be the most compelling way to incite more interest in the data?
- Why are the existing solutions not working? If they did, what part of them do you think worked?
- How can communication within the research community be enhanced to further the cause of data procurement?
These questions usually would lead to follow up questions based on how the interviewees would answer them and helped us unravel more information based on our prior research and the questions we had.

Interpretation Sessions
After each interview, the team huddled up and listened to the interview recording, highlighting notable comments and findings, each of which would be an affinity note. In these sessions, we would collaborate on our own understanding and interpretations of what the interviewee said. We would notice moments which we could pick up on to find out more about a particular piece of information.
Affinity Diagram
400+ key comments and quotes from interviews were attached to sticky notes as shown here. Notes were clustered with 5-6 other relevant comments/quotes. Clusters were then grouped (and so on) to form a hierarchy of granular patterns moving upwards to high-level themes. These helped us synthesize the plethora of information that we found and put them together to make a general sense of it.
Finding: Email is paramount
Email is a primary source of communication but is not being used most effectively. We noted from multiple interviewees that often emails are sent to researchers but don’t get responses because they are framed very generally and are not personalized. Furthermore, the continuous flow of instructional emails sent out don’t create a push because they are sent in such high volume and so often that they are frequently forgotten about.

Finding: Penetrating Social Media
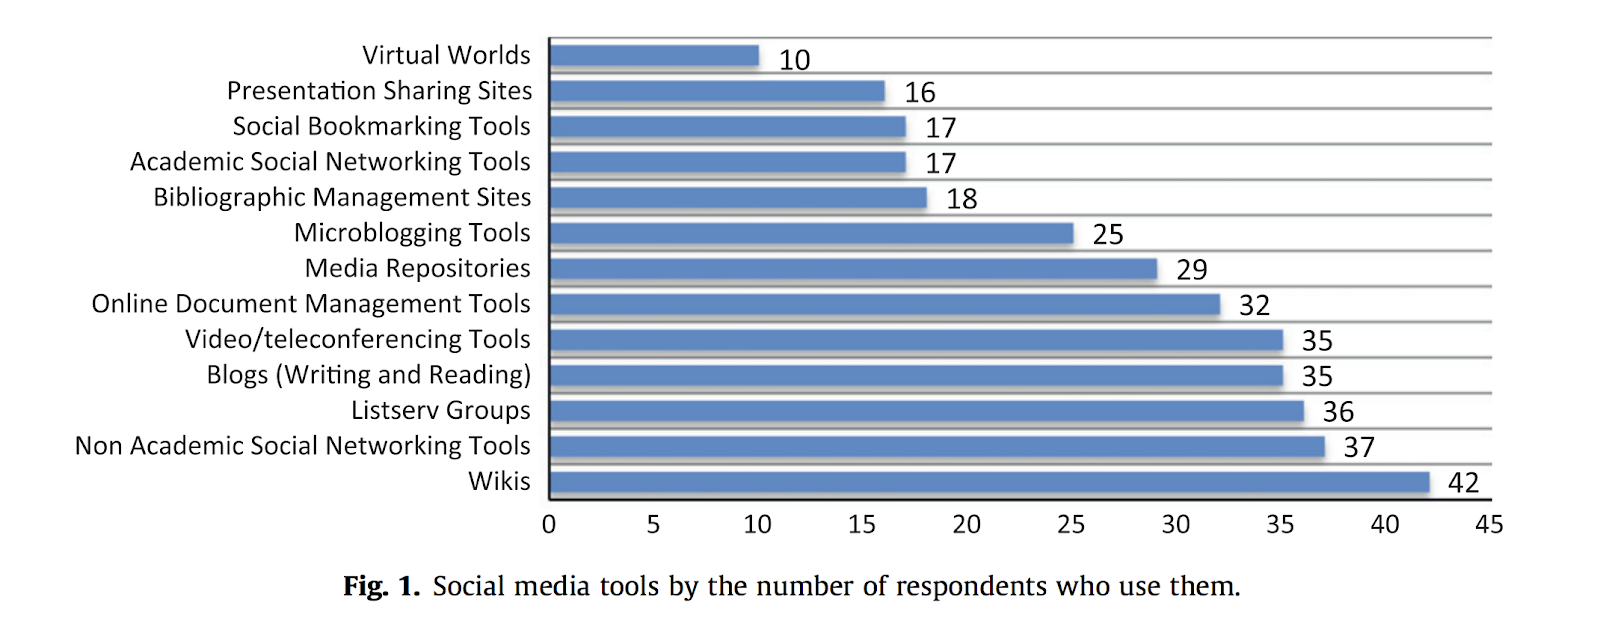
Social Media is leveraged, but could be utilized better. Social media has grown tremendously over the past several years. According to Gruzd, Staves & Wilk (2012), researchers are more aware of the power social media can have on their work. This group of researchers used the Unified Theory of Acceptance and Use of Technology (UTAUT) to assess the likelihood of scholarly use. As shown in figure 1 the most used social media tools are Wikis, social networking sites like Facebook, Listserv groups, Blogs and Video/teleconferencing Tools.
Finding: Technical Expertise is a challenge
Researchers often do not possess the skills (SQL, XPath/XQuery, SPARQL) to perform analysis on the data in a way that is useful to them. Often the data is available in the raw format and in order for this data to be useful to the researchers, it has to be synthesised but they do not have the required skills to perform those operations. Upon inspecting the guidance that the researchers get when they sign up with the client, we found the following:
- As soon as a researcher is onboarded, i.e. is signed up with the system, they get an email from The Research Support Team, requesting that “you read and sign the Acceptable Use Policy, view a 5-minute video on acceptable use guidelines, and take the brief knowledge quiz at the end of the video.” This email gives an impression that that the video and the quiz would inform the researcher on how to access the data.
- On the contrary, the researcher is walked through Data Import Protocols, Data Export and Disclosure Review Protocols, Post-Approval Modifications to Submitted Materials, Publication Acknowledgement and Data Citation, followed by an acknowledgement from the researcher that they have read and understood the policies. This seems standard for onboarding any regular online service. At this point, the researcher anticipates some sort of tutorial or guidance to get started.
Brainstorming
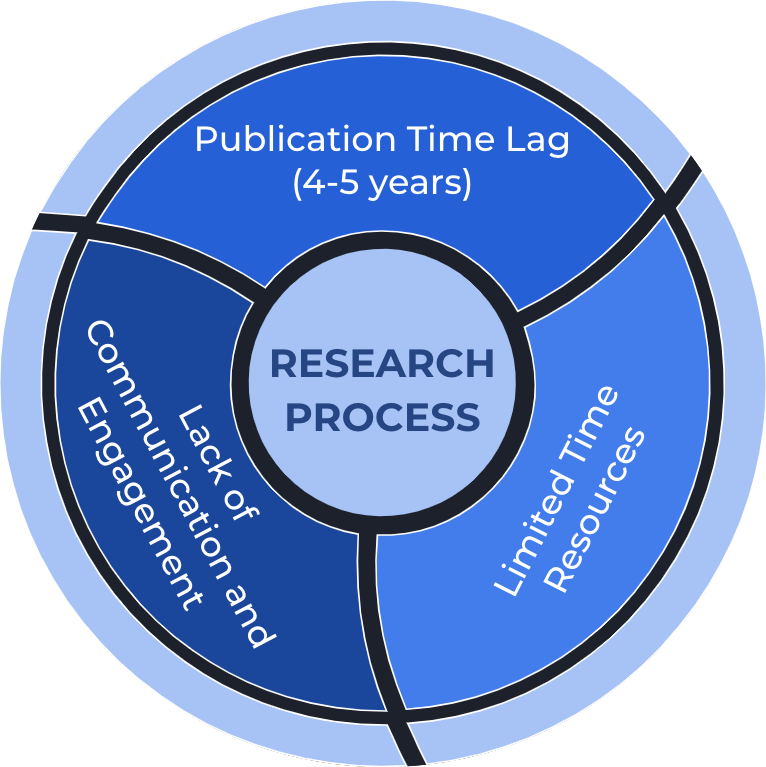
To organize our findings, we created a physical affinity wall which is a useful tool for data organization. For affinity wall, we printed all the meaningful/possibly meaningful interview findings and quotes and grouped 3-7 similar notes under a mother note and name it with a meaningful sentence that can overarch the rest of the notes. After we grouped all the notes, we had to iterate the grouping process twice more until there are only four bigger categories that can umbrella others: Outreach, Understanding and Communication. The process made us clear about the problem and observed findings from the interview so that we can have the ground for our solution brainstorming. We conducted further research to find the available options and weighed them on their efforts, feasibility and impact. We went deeper into our findings from background research interviews and our own synthesis to identify that the reasons for lack of awareness during the process time lag, limited resources and poor communication. While these were not apparant when we first started out, eventually they were very apparant.
Recommendations
After rigorous brainstorming and further research, we came up with several recommendations on how the institute can boost its presence in the research community. We performed analysis to narrow down these recommendations on the basis of feasibility and efforts to maximize outputs efficiently. This was particularly important because of the small team size and limited resources to implement these recommendations.
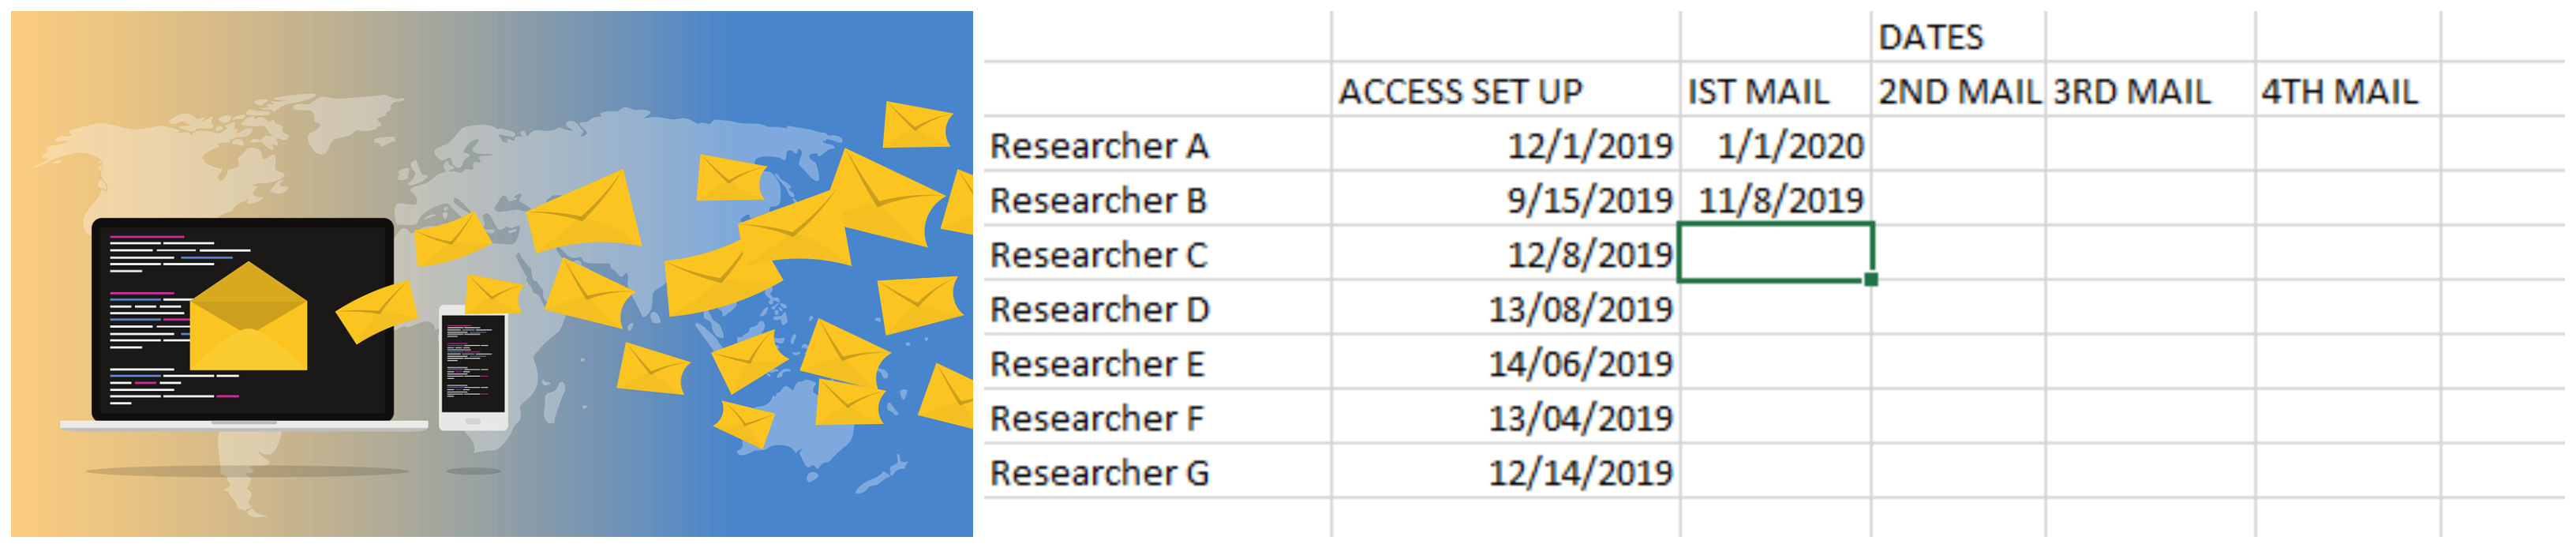
Recommendation: Personalised and Timed email
We recommend that the organization increases personalization in their email communication by using tools like mail merge. Microsoft word has a mail merge feature that is quite simple and beneficial for our client to use for this purpose. In summary, our client would need to engage with the mail merge wizard and feed the tool with the specified recipients, then type out the message and click “complete merge”. Utilizing this tool, client staff can customize the emails that are being sent out with researchers’ names and other personal information.
Recommendation: Rigorous social media engagement
Social media has grown tremendously over the past several years. The most popular social media tools are Wikis, social networking sites like Facebook, Listserv groups, Blogs and Video/teleconferencing Tools. One of the main benefits to using social media by scholars is the ability to facilitate collaboration within their research network. The sharing of tweets during conferences has been shown to be a good way to get information out to the public as well. One of the known downsides to social media is the time required to get the information out there. That being said, there is a belief that social media is the way of the future in terms of communicating, collaborating and disseminating information for scholars.

Recommendation: Better guidance to researchers
While our client provides significant education for researchers on how to access and cite the data repository, a few changes such as better connections between the onboarding resources and the best practices, and a different placement of these resources might help with the retention of the newly onboarded researchers. As soon as the researchers onboard, they should receive a welcome email that contains BOTH the guidelines on use restrictions of the data AND guidelines on how to use the data. There must be an easier access to find the guidance steps on both the website and the email that researchers receive when they are onboarded.
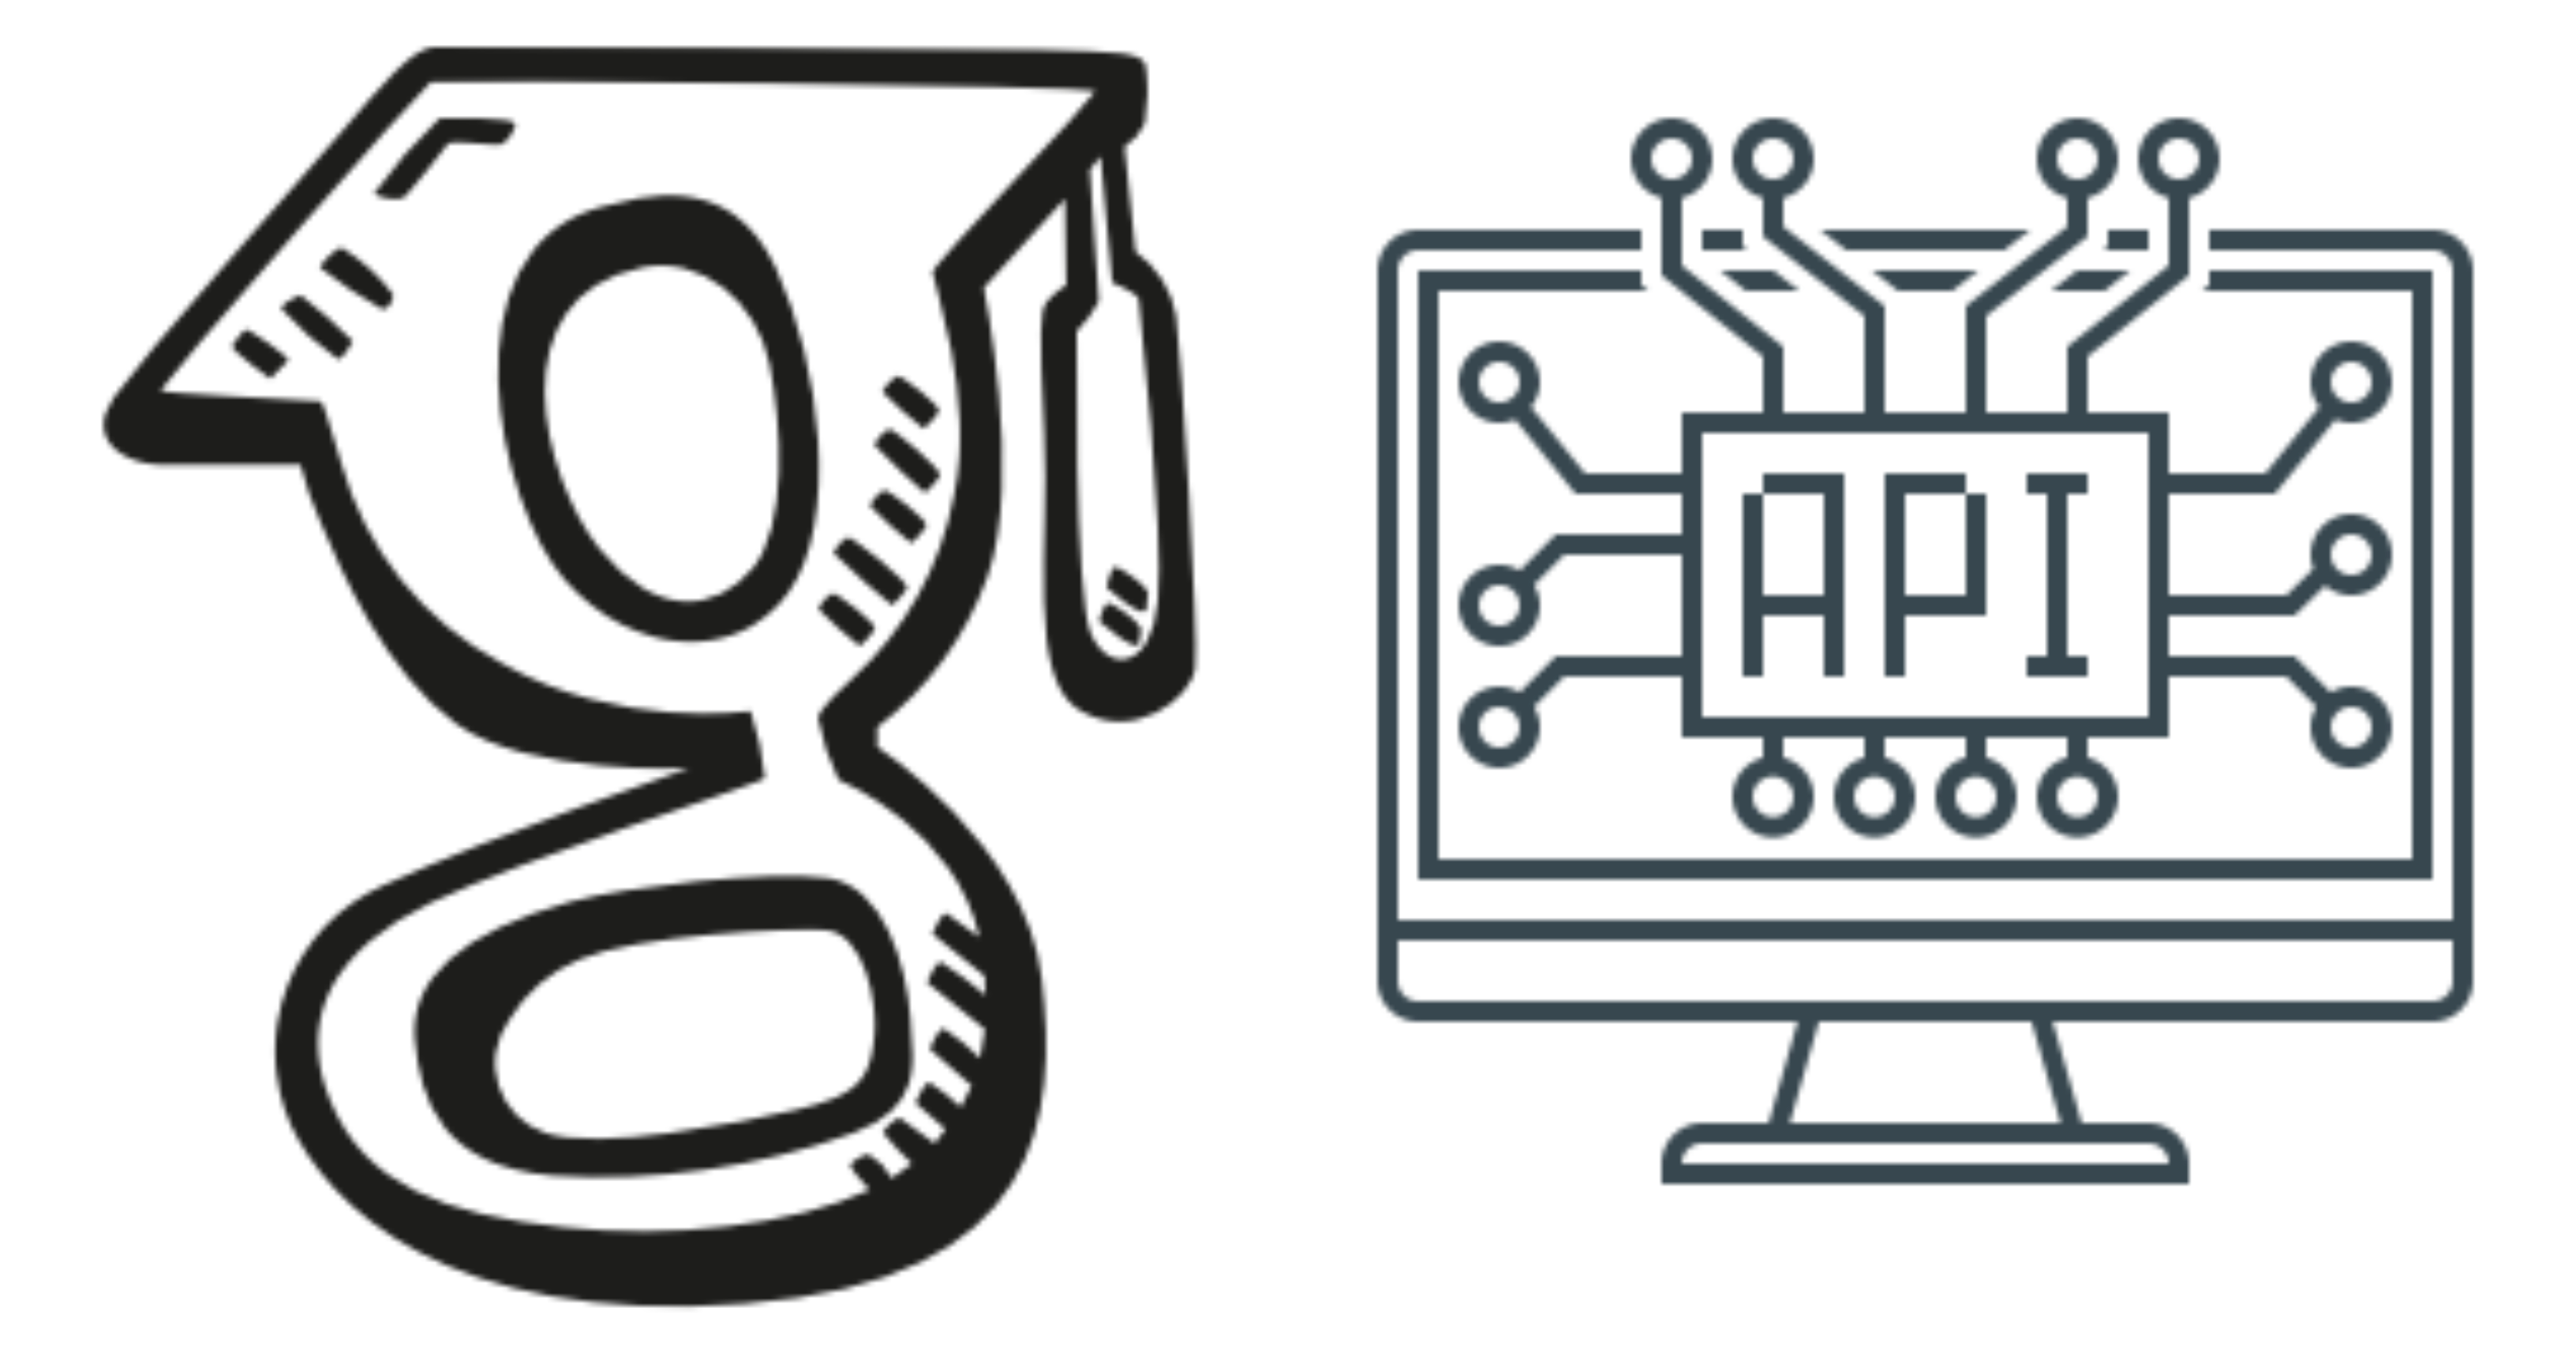
Recommendation: API and Google Scholar
We recommend the following solution for immediate implementation: Google Scholar alerts. This tool is our primary technical recommendation because it is free to use, easy and fast to set up, and fairly comprehensive in its reach. A recent study found that Google Scholar is “the most comprehensive academic search engine” at 389 million records (Gusenbauer, 2018). In our interviews, we learned that while client staff currently conduct manual Google Scholar searches these have been time consuming and not very effective, yielding false hits and missing other known publications. Setting up Google Scholar alerts will allow our client to save time on manual searching of publications and instead be notified any time a new publication matching the search terms appears in Google Scholar.
Key Takeaway
This institute is an academic institution that is looking to expand across the country at the same time continuing to make a positive impact on society by offering a unique dataset to researchers. Over the years, it has worked on this mission by allying with academic institutions with similar goals. Through the expansion of their client base, researchers and member universities, they will be able to build on the quality of their data. Through the contextual inquiry process we believe we identified five ways to help our client make a bigger impact through the application of one or more of the communication recommendations provided. While there is not a one size fits all solution to the issue of tracking research, with the improvement and expansion of current techniques as well as a multi prong approach to communication will have a positive impact on our client's brand and future growth.